

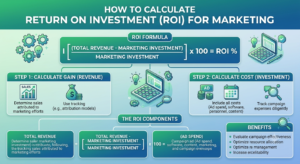
If you cannot tie a campaign to a number you cannot defend its budget. That is the truth behind every Return On Investment conversation in marketing. The good news is that the math is not complicated. The hard part is getting data and choosing the right way to attribute credit. Here is a practical walkthrough.
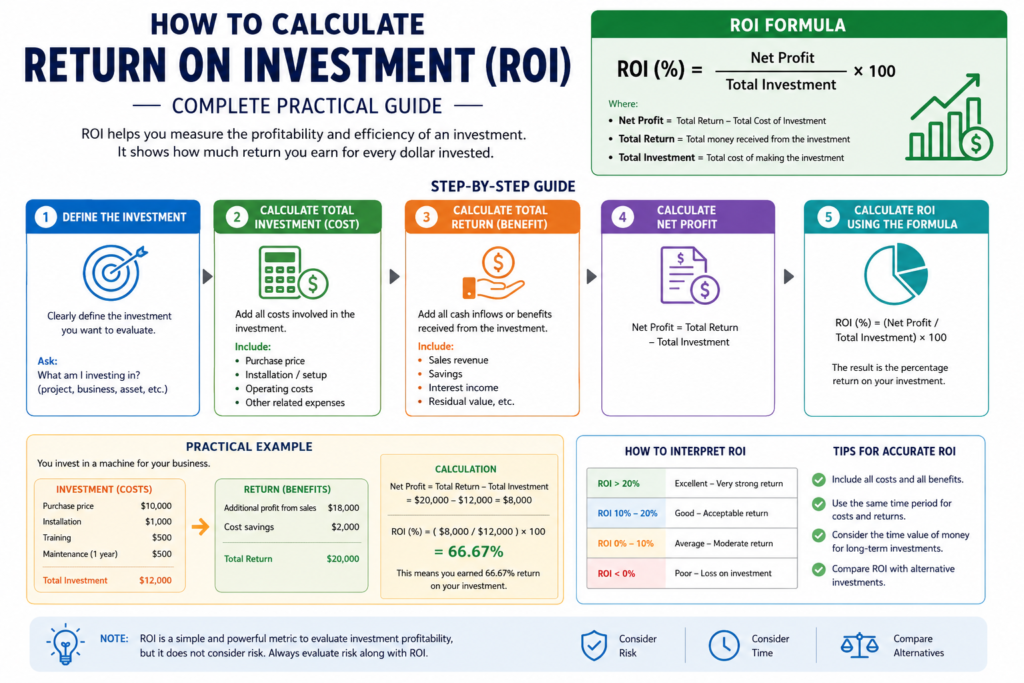
The Core Return On Investment Formula
The standard formula is simple:
Return On Investment = (Revenue Generated − Marketing Cost) / Marketing Cost × 100
If a campaign costs $5,000 and generates $20,000 in attributed revenue your Return On Investment is 300%. That means for every dollar spent you get three dollars back on top of your investment.
Marketing cost should include everything: ad spend, tools, creative production, agency fees and staff time if you want a loaded number. Skipping these makes Return On Investment look better than it really is.
Return On Investment vs. Return On Ad Spend: Do Not Confuse Them
Return On Ad Spend and Return On Investment get used interchangeably. They answer different questions. Return On Ad Spend is revenue divided by ad spend. A top-line efficiency metric used for day-to-day optimization decisions like which creative to scale. Return On Investment factors in costs and measures whether the campaign was actually profitable for the Digital Marketing Campaigns. A campaign can have a Return On Ad Spend and a mediocre Return On Investment if overhead and production costs eat into the margin.
For context on what “looks like: eCommerce Return On Ad Spend currently averages somewhere in the 2.87:1 to 4:1 range depending on the source and methodology with wide swings by channel. Google Search and Shopping campaigns tend to sit because they capture buyers who already have purchase intent while awareness-oriented placements like Display and TikTok trend lower. The number that actually matters is not the industry average. It is your break- Return On Ad Spend calculated as 1 divided by your gross margin. A business with a 40% margin needs at a 2.5:1 return just to break even; a 25%-margin business needs 4:1.
Building the Calculation Step by Step
- Define the conversion. Sale, lead, signup or app install. Pick the outcome that maps to revenue.
- Assign a value. For sales use actual revenue. For leads use deal value × close rate.
- Total your costs. Ad spend, platform fees, content production, tools and labor.
- Choose an attribution model. This is where reported Return On Investment can swing the most.
- Run the formula. Compare against your break-even threshold, not a generic benchmark.
Attribution: The Variable Everyone Underestimates
The same campaign can show different Return On Investment depending on whether you use first-touch last-touch or multi-touch attribution. Last-touch gives all credit to the click before conversion. Usually search or email. Which tends to undervalue upper-funnel channels like social and display that built awareness earlier in the journey. First-touch does the opposite. Multi-touch models split credit across the path offering a balanced picture.
There is no correct” model. The practical advice from analysts working with ad accounts is consistency: pick one model apply it across campaigns and use it to track trends over time rather than chasing precision you cannot actually verify. If you run -channel campaigns this consistency matters even more since each channel will look better or worse purely based on where it sits in the customer journey.
Accounting for What the Formula Misses
Basic Return On Investment calculations struggle with two things: lift and long-term value.
- Incremental lift asks whether the sale would have happened anyway without the ad. Total conversions overstate impact; a holdout group or geo-test gets you closer to the incremental number.
- Customer Lifetime Value matters because a campaign with a “first-purchase Return On Investment can still be a great investment if those customers stick around. Businesses with repeat-purchase behavior often deliberately accept a lower first-touch Return On Ad Spend evaluating campaigns instead on a 90-day LTV-to-CAC ratio.
A useful sustainability check: keep your customer lifetime value least three times your customer acquisition cost.
Improving Return On Investment After the Campaign Ends
- Kill creative early and reallocate budget to winners.
- Refresh ad creative every 2–3 weeks to fight fatigue especially on paid social.
- Tighten targeting with negative keywords and exclusion audiences.
- Build retargeting and post-purchase flows. They are consistently among the highest-Return On Investment activities because they work on warmer audiences.
- Revisit your attribution window; a window that is too short can undercount conversions that happen days later.
The Takeaway
Return On Investment is not a number you calculate once. It is a lens you apply consistently with the right costs, a defined attribution model and an honest look at incrementality and lifetime value. Get those four pieces right. The formula does the rest.
The Return On Investment Myopia Trap: Why Teams Need Brand-Building Metrics Too
Picture a product team that cuts customer support staff by 30% to hit a cost target. The dashboard lights up green. Leadership applauds the savings. Three months later response times have tripled churn is creeping up. Word has spread internally that “support is not a priority here anymore.” The Return On Investment number looked great. The damage to trust. With customers and with the teams people. Never showed up on that report.
This is Return On Investment myopia: optimizing for what’s easy to count in a quarter while ignoring what actually compounds a teams value over years.
Why Short-Term Return On Investment Falls Short
Return On Investment metrics are seductive because they are fast, comparable and easy to defend in a budget meeting.. They have real blind spots:
- They reward extraction, not investment. Cutting a training budget improves this quarters margin while quietly eroding capability for the five quarters.
- They cannot see damage until it is expensive. A rushed feature that hits its Return On Investment target but breaks trust with users often shows up as a retention problem two quarters later. After the team responsible has moved on to the win.
- They miss compounding effects. Brand equity, culture and trust behave like interest not like a one-time payout. Intangible assets now make up 90% of S&P 500 market value, a dramatic shift from just 17% in 1975. Meaning most of what a company is actually worth was never designed to fit on a quarterly Return On Investment slide.
Brand, Culture and Trust Are Not “Soft”
It is tempting to file culture and internal brand under “nice to have.” The numbers say otherwise. Gallups meta-analysis found a true-score correlation of 0.42 between employee engagement and composite performance with top-half business units doubling their odds of success compared with bottom-half units. Recent data sharpens the picture: work units in the top quartile of engagement outperformed bottom-quartile units by 22% in profitability and 21% in productivity while also seeing sharply lower turnover, shrinkage and safety incidents.
At the level global intangible assets. Brand, IP and workforce-related value. Reached an all-time high of $79.4 trillion in 2024 a 28% jump from the prior year. Most of that value never appears on a balance sheet, which’s exactly why teams that only track Return On Investment systematically undercount what they are building.
There is also a timing mismatch naming: brand and culture initiatives rarely show measurable external effects inside a single quarter. Trust erodes slowly. Rebuilds slowly. A team that judges every initiative on a 90-day Return On Investment window will consistently defund the things. Onboarding quality, internal communication, consistent customer follow-through. That pay off 12 to 24 months out.
A Practical Framework: Dual-Track Metrics
than replacing Return On Investment pair it with a parallel brand-health track reviewed on a different cadence.
Track 1. Return On Investment (Quarterly)
Cost savings, revenue per initiative output volume, cycle time.
Track 2. Brand & Trust Health (Biannual)
- Internal brand alignment: Do team members describe the teams purpose the way leadership does?
- Trust in leadership: Pulse survey items on follow-through, transparency and fairness.
- Cross-team collaboration quality: How do other teams voluntarily seek this team out?
- External brand signals: Customer/partner sentiment, referral rate, unsolicited praise or complaints.
- Employee engagement: A short consistent survey tracked over time not at exit.
Checklist: Balancing Return On Investment With Brand-Building
- Set one “durability” metric alongside every Return On Investment target.
- Run brand-health reviews on a fixed schedule. Do not let them get bumped by quarterly fire drills.
- In performance reviews explicitly score contributions to culture and trust not just delivered output.
- Before approving a ” win ” ask: what does this cost in trust, retention or reputation 12 months, from now?
- Give brand/culture metrics a named owner, the way Return On Investment has a finance owner.
- Share both tracks with the leadership team never let the return on investment be the only number that people are talking about in the room.
The Bottom Line
The return on investment for a period of time tells you if things are going well right now.. The brand and the culture and the trust that people have in the team tell you whether it is still a good idea to invest in the team three years from now. Teams that think both of these things are important. Not one or the other. Are the teams that do well for a long time. The return on investment and the brand and culture and trust are both things to consider when you are making decisions about the team. Teams that treat the return on investment and the brand and culture and trust, as important are the teams that build performance that actually lasts.