

How GA4 Reports Helped Us Find and Fix a Checkout Funnel Leak
A months ago one of our clients who sells things online came to us with a problem. They said “We have more people visiting our website but we are not getting sales.” This is a problem that many people who do marketing have heard before. It usually means that something is not working between the people who are interested in our products and the people who actually buy them. In this case the problem was in the checkout process.. Ga4 helped us find it.
This is not a story. It is what really happened. We are going to tell you what we did what reports we used and what we found out. If you are new to GA4 and want to learn how to use it to analyze funnels you can use this as a guide.
The Problem in Simple Terms
Our client has a sized online store that sells things for the home. They had more people visiting their website. They were not getting more sales. They thought maybe their ads were not working well.. We thought maybe there was a problem with the checkout process. Because if more people are visiting the website but the checkout process is not working then people are just leaving.
We know that a lot of people who start to buy something do not finish. This is normal.. We wanted to know if our clients website was losing more people than usual. GA4 helped us figure out where people were leaving and why.
Step 1: Set Up the Funnel Exploration Report
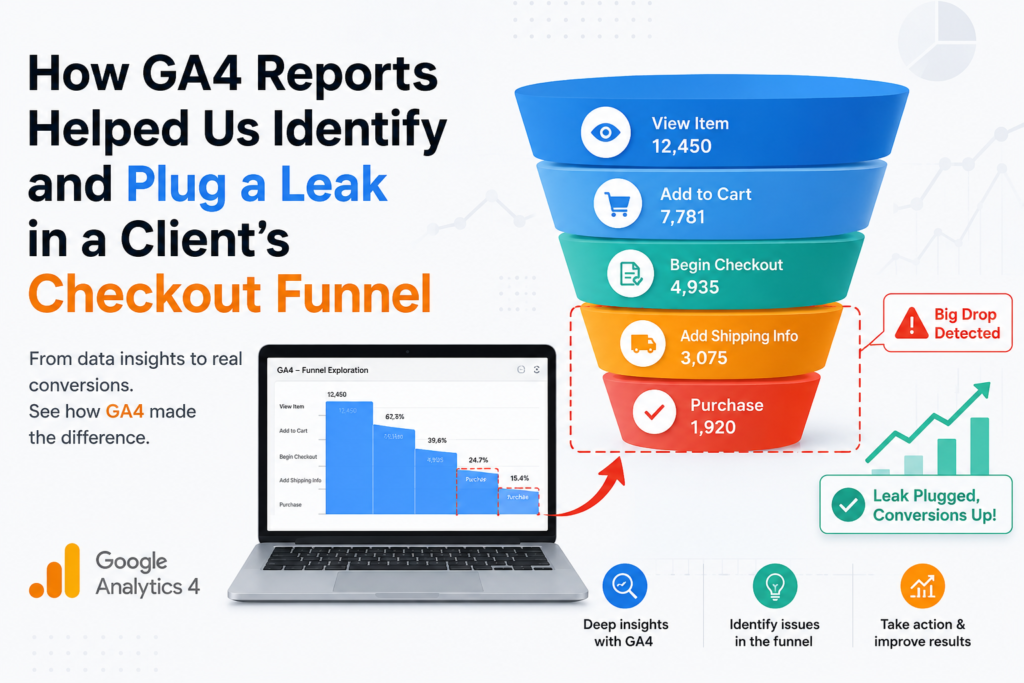
We started by making a funnel report. We mapped out the steps people take when they buy something on our clients website:
- They look at a product.
- They add it to their cart.
- They start the checkout process.
- They add their shipping information.
- They add their payment information.
- They complete the purchase.
This is the process that most online stores use. If our clients website was not tracking these steps correctly then we would not be able to trust the data. So we made sure that these steps were being tracked.
When we looked at the funnel report we saw that a lot of people were leaving after they added something to their cart. 45% Of people who added something to their cart did not even start the checkout process. This was higher than usual. It was the biggest problem we saw.
Step 2: Confirm It Was Not a Fluke
Before we did anything we wanted to make sure that this was not a coincidence. So we looked at the data for types of devices and traffic sources. We used the comparison feature in GA4 to do this.
What we found out was that the problem was worse on devices. People who used desktop computers were more likely to complete the checkout process.. People who used mobile devices were leaving at a much higher rate. This told us that the problem was probably related to the version of the website.
Step 3: Use Path Exploration to See Where They Actually Went
The funnel report told us that people were leaving. It did not tell us where they went. So we used the Path Exploration report to find out. We started with the people who added something to their cart and then left. We wanted to know what they did next.
What we found out was that a lot of people just stopped. They did not do anything on the website. Some people went back to the homepage, which meant that they were probably confused.
Step 4: Check for Broken Events
GA4 tracks events, which are specific actions that people take on the website. So we used the Events report to see if the checkout button was working correctly on devices. We also used DebugView to test it.
What we found out was that the checkout button was partially hidden on some devices. This meant that some people could not even click on it.. When they could not click on it they just left the website.
Step 5: Check Site Speed as a Contributing Factor
We also looked at how the website was loading on mobile devices. We know that if a website takes long to load people will leave.. What we found out was that the checkout page was loading slower on mobile devices than on desktop computers. This was making the problem worse.
The Fixes We Implemented
Once we knew what the problem was we made some changes to the website:
- We fixed the version of the website so that the checkout button was not hidden.
- We made sure that the checkout button was working correctly on all devices.
- We made the website load faster on devices.
- We made a change to the payment step to make it easier for people to use.
These changes were not big. They made a big difference. We did not just guess what to fix. We used the data to tell us what to do.
Validating the Fix
We did not just make the changes and hope for the best. We looked at the data again to see if the changes worked. We rebuilt the funnel report. Compared it to the old data.
What we found out was that the changes worked. The number of people who left after adding something to their cart decreased. The number of people who completed the checkout process increased.. The revenue from mobile devices increased.
A Simple Checklist You Can Reuse
If you want to do the thing here is a simple checklist:
- Make a funnel report that shows the steps people take when they buy something on your website.
- Find the step where the most people are leaving.
- Look at the data for types of devices and traffic sources to see if the problem is specific, to one group.
- Use Path Exploration to see where people go after they leave.
- Check the Events report to make sure that the buttons and links are working correctly.
- Look at the site speed to see if it is contributing to the problem.
- Make one change at a time. Test it to see if it works.
- Look at the data again to see if the change worked.
Final Thoughts
The important thing we learned from this project was to follow the right order of operations. First we used Funnel Exploration to find the problem. Then we used Path Exploration and the Events report to figure out why it was happening. Then did we make changes to the website. If you skip these steps you might fix something that is not really broken. GA4 is a tool that can help you find and fix problems on your website.A months ago one of our clients who sells things online came to us with a problem. They said “We have more people visiting our website but we are not getting sales.” This is a problem that many people who do marketing have heard before. It usually means that something is not working between the people who are interested in our products and the people who actually buy them. In this case the problem was in the checkout process.. Ga4 helped us find it.
This is not a story. It is what really happened. We are going to tell you what we did what reports we used and what we found out. If you are new to GA4 and want to learn how to use it to analyze funnels you can use this as a guide.
The Problem in Simple Terms
Our client has a sized online store that sells things for the home. They had more people visiting their website. They were not getting more sales. They thought maybe their ads were not working well.. We thought maybe there was a problem with the checkout process. Because if more people are visiting the website but the checkout process is not working then people are just leaving.
We know that a lot of people who start to buy something do not finish. This is normal.. We wanted to know if our clients website was losing more people than usual. GA4 helped us figure out where people were leaving and why.
Step 1: Set Up the Funnel Exploration Report
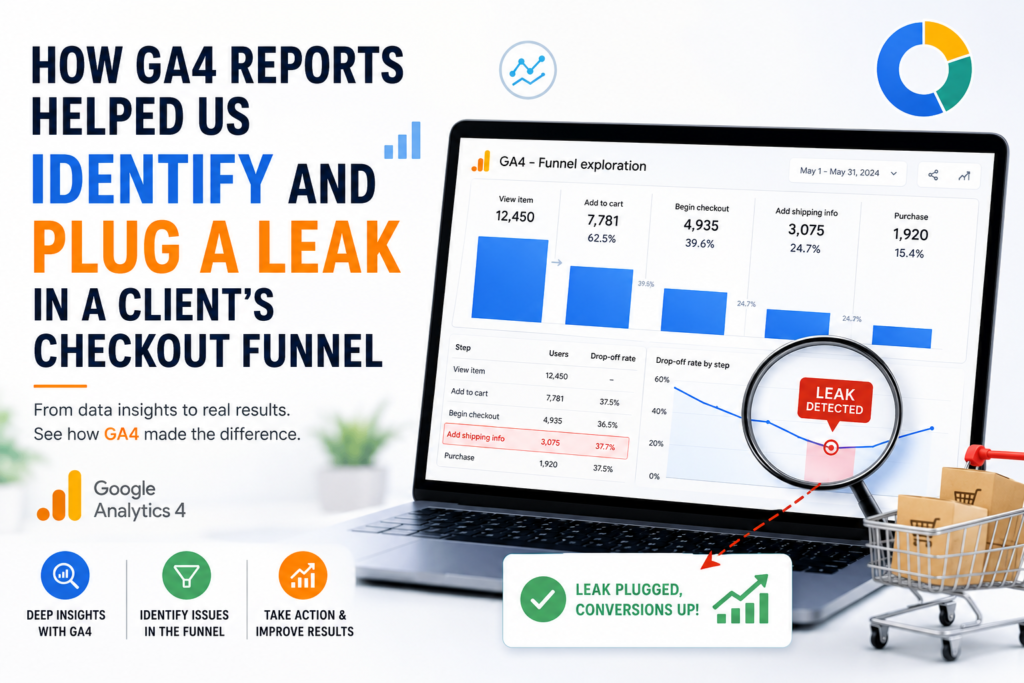
We started by making a funnel report. We mapped out the steps people take when they buy something on our clients website:
- They look at a product.
- They add it to their cart.
- They start the checkout process.
- They add their shipping information.
- They add their payment information.
- They complete the purchase.
This is the process that most online stores use. If our clients website was not tracking these steps correctly then we would not be able to trust the data. So we made sure that these steps were being tracked.
When we looked at the funnel report we saw that a lot of people were leaving after they added something to their cart. 45% Of people who added something to their cart did not even start the checkout process. This was higher than usual. It was the biggest problem we saw.
Step 2: Confirm It Was Not a Fluke
Before we did anything we wanted to make sure that this was not a coincidence. So we looked at the data for types of devices and traffic sources. We used the comparison feature in GA4 to do this.
What we found out was that the problem was worse on devices. People who used desktop computers were more likely to complete the checkout process.. People who used mobile devices were leaving at a much higher rate. This told us that the problem was probably related to the version of the website.
Step 3: Use Path Exploration to See Where They Actually Went
The funnel report told us that people were leaving. It did not tell us where they went. So we used the Path Exploration report to find out. We started with the people who added something to their cart and then left. We wanted to know what they did next.
What we found out was that a lot of people just stopped. They did not do anything on the website. Some people went back to the homepage, which meant that they were probably confused.
Step 4: Check for Broken Events
GA4 tracks events, which are specific actions that people take on the website. So we used the Events report to see if the checkout button was working correctly on devices. We also used DebugView to test it.
What we found out was that the checkout button was partially hidden on some devices. This meant that some people could not even click on it.. When they could not click on it they just left the website.
Step 5: Check Site Speed as a Contributing Factor
We also looked at how the website was loading on mobile devices. We know that if a website takes long to load people will leave.. What we found out was that the checkout page was loading slower on mobile devices than on desktop computers. This was making the problem worse.
The Fixes We Implemented
Once we knew what the problem was we made some changes to the website:
- We fixed the version of the website so that the checkout button was not hidden.
- We made sure that the checkout button was working correctly on all devices.
- We made the website load faster on devices.
- We made a change to the payment step to make it easier for people to use.
These changes were not big. They made a big difference. We did not just guess what to fix. We used the data to tell us what to do.
Validating the Fix
We did not just make the changes and hope for the best. We looked at the data again to see if the changes worked. We rebuilt the funnel report. Compared it to the old data.
What we found out was that the changes worked. The number of people who left after adding something to their cart decreased. The number of people who completed the checkout process increased.. The revenue from mobile devices increased.
A Simple Checklist You Can Reuse
If you want to do the thing here is a simple checklist:
- Make a funnel report that shows the steps people take when they buy something on your website.
- Find the step where the most people are leaving.
- Look at the data for types of devices and traffic sources to see if the problem is specific, to one group.
- Use Path Exploration to see where people go after they leave.
- Check the Events report to make sure that the buttons and links are working correctly.
- Look at the site speed to see if it is contributing to the problem.
- Make one change at a time. Test it to see if it works.
- Look at the data again to see if the change worked.
Final Thoughts
The important thing we learned from this project was to follow the right order of operations. First we used Funnel Exploration to find the problem. Then we used Path Exploration and the Events report to figure out why it was happening. Then did we make changes to the website. If you skip these steps you might fix something that is not really broken. GA4 is a tool that can help you find and fix problems on your website.